
Abstract
Free-space optics allows for design freedom and control, but miniaturization and manufacturability are limited. Here, we present a method for manufacturing complex miniaturized free-space optical systems that combines contactless femtosecond laser-activated alignment with femtosecond laser 3D manufacturing of a substrate incorporating optomechanical elements. Specifically, we demonstrate a palm-sized, all-glass GHz femtosecond laser cavity, whose alignment and lasing operation are permanently tuned in a contactless manner via laser–matter interaction using another femtosecond laser. The manufactured Yb:KYW oscillator shows self-starting mode-locking with a diffraction-limited beam and outputs a stable train of solitons with 182 fs pulse width at 1.0925 GHz repetition rate, for 725 mW incident pump power.
© 2023 Optica Publishing Group under the terms of the Optica Open Access Publishing Agreement
1. INTRODUCTION
Due to the brevity of their pulses, femtosecond lasers are becoming ubiquitous in numerous applications, not only for those requiring high-peak power to trigger non-linear optical responses as in 3D micro-manufacturing [1,2] or for surgical applications [3], but also for metrology [4] and innovative spectroscopic applications [5] based on optical frequency combs (OFCs) [6].
Femtosecond laser oscillators [7–9] are implemented in three different manners, relying on free-space bulk optics [10], fiber optics [11], or integrated optics [12], each having its own merits and limitations.
Among these three methods, free-space optics offers substantial design freedom, such as a control of the cavity mode size and leading performances in terms of power scaling and signal-to-noise ratio (SNR). However, it comes at the cost of intrinsic limited miniaturization capabilities and manufacturability.
To address these issues, here, we explore a novel concept of free-space femtosecond lasers, made almost entirely of glass, in which components of the laser cavity are placed in a preformed glass substrate, and subsequently aligned using femtosecond laser–matter interaction rather than the typical mechanical interaction.
We illustrate the merit of this method by applying it to the specific case of GHz repetition rate femtosecond laser cavities (i.e., light pulse round trip length ${\lt}\;{{30}}\;{\rm{cm}}$), which represents a particular case for free-space optics due to the small size of the cavity.
Among previous attempts to manufacture compact GHz cavities, Shoji et al. [13] showed a quasi-monolithic laser source in which custom-made glass components are precisely and manually cemented together. Even unstabilized, the device achieves ultra-low intensity noise and phase noise performances. In this particular work, detrimental thermal effects (i.e., power limitation, mode distortion) were prevented by cooling of the Yb:Er:glass crystal via the internal contact to the ${\rm CaF_2}$ spacer.
Using conventional assembly methods, Feng et al. built a ring-oscillator Kerr-locked GHz laser by bonding the glass components directly onto an aluminum substrate [14] also acting as a heat sink. While aluminum is light and suited to heat extraction, its coefficient of thermal expansion (CTE ${\sim}23\,{{\unicode{x00B5}}}/{\rm{m}}/^\circ {\rm{C}}$) is rather large, leading to significant cavity length (i.e., repetition rate) fluctuations that must be compensated for by active stabilization. Despite this disadvantage, the authors managed to keep the standard deviation within 143 nm (i.e., 1.08 kHz), at room temperature ${\pm}1^{\circ}$.
Departing from these attempts, our approach builds upon a concept of a single micromachined substrate with a pre-defined components holder and embedded flexural elements [15–17] that are subsequently adjusted down to sub-nanometer resolution [18–20] by non-contact means, taking advantage of volume changes induced by volumetric non-ablative laser exposure [21].
Using a single substrate offers a pathway to address inherent reliability, manufacturability, and precision requirements for free-space optics GHz cavities. First, a single substrate provides a reference coordinate frame that is shared by all elements, which is necessary to position and align them accurately with respect to one another. Second, the use of a single innovative 3D laser processing method (here, femtosecond laser exposure combined with etching), combined with precision engineering design methods offers a positioning accuracy before adjustment, close to 1 µm, as all the reference surfaces are manufactured at once using a single manufacturing platform. Third, the use of fused silica provides superior thermal stability, against temperature fluctuations, yet with a Young’s modulus similar to aluminum. Fused silica has the lowest CTE among non-engineered materials (two times lower than Invar, approximately 40 times better than aluminum and 16 times better than steel, two materials commonly used for mirror mounts).
In general, the use of ultra-low CTE (i.e., ${\lt}1\,\,{{\unicode{x00B5}{\rm m}}}/{\rm{m}}/^\circ {\rm{C}}$) glass and engineered ceramics [22], such as fused silica [23], Zerodur [24] or ultra-low expansion (ULE) [25], is key to achieve thermal and mechanical stability.
In essence, a laser is used to make another laser, not only for substrate manufacturing, but also for fine alignment and tuning.
As will be shown here, such an approach offers a paradigm shift to free-space laser-cavity manufacturing and a pathway to highly integrated, palm-sized, yet stable laser sources with excellent beam quality and high-peak-power pulses.
2. LASER CAVITY CONCEPT AND DESIGN
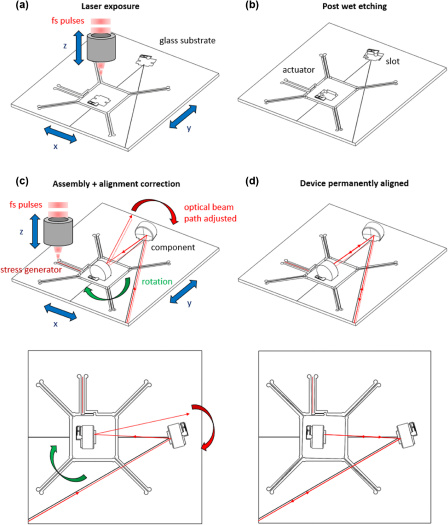
Figure 1 presents the generic concept of operation of an “all-glass” optical device. For the sake of simplicity, only a few elements are represented, but the concept is naturally scalable to as many elements as needed. In Fig. 1(a), a glass substrate is manufactured by 3D femtosecond direct laser writing. The substrate acts as a template with pre-aligned slots for the various components, curved and flat miniature mirrors in this case, and a built-in micro-adjuster to fine tune the optical alignment, here, with only one degree of freedom to adjust the yaw of the second mirror. Figure 1(b): after development in a chemical bath, the various elements are freed by the removal of the exposed pieces. Figure 1(c): the mirrors can be inserted inside the pre-aligned slots by either a human operator or robot gripper, and are held in position by built-in clamps. The components can be bonded permanently to the glass substrate using a suited adhesive, UV-cured epoxy, for instance, or by femtosecond laser welding [26]. Due to fabrication tolerances, mainly from the components themselves, and to a lesser extent, stemming from the substrate machining, a light beam propagating in the device can stray from the ideal optical path. In this scenario, it is intended for the light beam to reflect on the second mirror and overlap itself, as is the case in an optical standing-wave resonator. Due to a lateral shift of the beam propagating towards the curved mirror, the light beam misses the center of the component and reflects at an angle towards the second flat mirror; since the beam is not incident at a normal angle, it cannot get reflected back into the same path. In this concept, the original lateral offset of the beam cannot be corrected; however, the optical surface of the second mirror can be adjusted, and the micro-adjuster can be actuated by the writing of a stress generator (or “stressor”) with a femtosecond laser, using the same laser micromachining setup.

Fig. 1. Generic concept of an “all-glass” optical device, with the various stages of fabrication. (a) Femtosecond laser manufacturing of the glass substrate with precisely pre-aligned slots and a flexure mechanism to complete the optical alignment. The blue arrows indicate the coordinated motions of the platform carrying the substrate and of the focusing objective. (b) Freeing of the embedded structures after laser enhanced wet etching. (c) During the assembly process, optical components, here two mirrors, are inserted inside the slots and may be bonded by some adhesive or welded using a femtosecond laser. The micro-adjuster platform carrying the second mirror can be rotated to fine tune the circulation of a beam propagating inside the device. This is done by the inscription of a stressor within an actuating part, using once more a femtosecond laser. The green arrow shows the rotation of the micro-adjuster platform. The red arrow shows the adjustment in the optical beam path. (d) The optical sub-system is permanently aligned and ready for packaging.
This will rotate the whole carrier platform and correct the beam path with ultrahigh angular resolution. The process is contactless and can be performed through an access window, during the last packaging steps after hermetic sealing. Figure 1(d): with proper mechanical design and stress loading, the deformation can hold indefinitely, and the optical device is thus permanently aligned (a.k.a. set-and-forget) and ready for use.
In this step-by-step generic packaging adjustment principle, reversibility in motion direction is achieved through design [18–20]. The flexure mechanism itself is elastic; hence it can be loaded or unloaded in both directions. However, the force resulting from the “stressor” and applied to deform the flexure remains permanent. The element that provides the force (here, a bar exposed to the laser beam as can be seen in Fig. 1) can be driven in opposite directions and hence can provide a bi-directional motion. Certainly, this can be done only a limited number of times, i.e., for how much space is available for laser exposure. By design, sufficient space on this bar is allowed for rapidly converging to the desired final permanently deformed flexure position.
In this context, static stress stability is essential for maintaining the element. In a dedicated study, we reported [27] no observable change for an extended period (${\gt}{{1}}$ year) and under varying atmospheric conditions, for stress levels up to nearly a GPa.
Another aspect is the effect of temperature on positioning stability. Based on a previous work [28], the relative CTE increase in the laser-exposed areas is estimated at most to be in the range of ${\sim}1\;{{\unicode{x00B5}{\rm m}}}/{\rm{m}}/^\circ {\rm{C}}$ for the experimental conditions described here. This value can be reduced by selecting other laser exposure parameters and/or by compensating for CTE-mismatch expansion, through design.
The manufacturing details will be further discussed in the next section. Before that, let us discuss the GHz laser cavity design and its working principle.
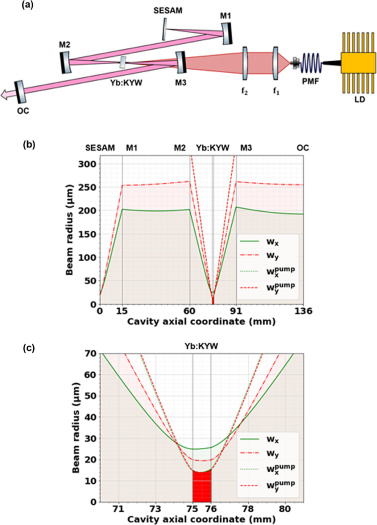
The laser cavity shown in Fig. 2(a), whose layout is inspired by [29], adopts a modified ${{Z}}$-shaped arrangement with three curved folding mirrors (M1, M2, and M3), and a gain medium (Yb:KYW biaxial crystal) placed in between the two end-mirrors, consisting of an output coupler (OC) and a semiconductor saturable absorber mirror (SESAM). Using a pair of lenses (${f_1} \simeq 11.16\;{\rm{mm}}$, ${f_2} \simeq 38.1\;{\rm{mm}}$), the crystal is optically pumped through a dichroic mirror (M3) with the continuous-wave (CW) light of a single-mode laser diode pigtailed to a polarization maintaining fiber (PMF) (2000CHP 3CN01376JL, from 3SPTechnologies), centered at ${\sim}979.5\;{\rm{nm}}$ and that can deliver up to 950 mW. The pump beam propagates along the ${N_g}$ crystallo-optics axis, with its linear polarization oriented onto ${N_m}$, set parallel to the drawing plane. The pump and cavity mode diameters as a function of position Fig. 2(b) are computed via ABCD formalism using the free reZonator software package [30]. From left to right, starting from the SESAM, the $45\;{\rm{\unicode{x00B5}{\rm m}}}$ wide beam expands about 10 times and gets collimated by mirror M1. The SESAM (from BATOP GmbH) has a saturation fluence of ${F_{{\rm sat}}} \simeq 50\;{\rm{\unicode{x00B5} J}}/{\rm{cm}}^2$, modulation depth of $\Delta {\rm{R}} \simeq 0.9\%$, non-saturable losses of ${A_{{\rm ns}}} \simeq 0.6\%$, and relaxation time constant of $\tau \sim 1\;{\rm{ps}}$. The front surface of M1 (${\rm{R}} \simeq 99.9\%$, 30 mm radius of curvature) is coated with a Gires–Tournois interferometer (GTI) coating giving a negative group-delay dispersion (GDD) ${\simeq}\, { - }800 \pm 100\;{\rm{f}}{{\rm{s}}^2}$ dispersion to ensure the generation of a stable soliton. The beam propagates to the highly reflecting mirror M2 (${\rm{R}} \simeq 99.98\%$, 30 mm radius of curvature), which focuses it down to the mirror image of the SESAM spot into the gain crystal. After exiting the crystal, the beam expands again about 10 times and gets re-collimated by mirror M3 (${\rm{R}} \simeq 99.9\%$, 30 mm radius of curvature). Finally, the beam propagates towards the OC, through which part of the intracavity power is extracted. The OC is a mirror with ${T_{{\rm OC}}} \simeq 1\%$ transmission and a wedge on the backside to prevent back-reflections from returning inside the cavity. The output ellipticity is about 0.75 ($510\;{{\unicode{x00B5}{\rm m}}} \times 380\;{{\unicode{x00B5}{\rm m}}}$ ellipse). Assuming a refractive index ${n_g} \simeq 2.037$ for the Yb:KYW crystal at ${\sim}1\;{{\unicode{x00B5}{\rm m}}}$ wavelength, the total optical cavity length is approximately 137 mm, predicting ${f_{{\rm rep}}} \simeq 1.0938\;{\rm{GHz}}$ repetition rate. To minimize beam astigmatism, the cavity angles are made as small as possible (i.e., components rotated less than 7.5°). These angles are constrained only by the size of the actual individual components used (see the oscillator fabrication section) and not by the substrate itself. Hence, the smaller the components, the smaller the angles.
Fig. 2. (a) Schematic of the diode-pumped solid-state laser oscillator configuration seen from top. The modified ${{Z}}$-shaped cavity is composed of a SESAM and output coupler OC end mirrors, with three folding curved mirrors: M1 (Gires–Tournois interferometer), M2 and M3 (dichroic), and a Yb:KYW gain crystal placed in between. The gain crystal is pumped by the focusing of a PMF-pigtailed laser diode using a pair of collimating and focusing lenses. (b) Cavity mode half-waist as a function of longitudinal position along the cavity optical axis, green solid (red dashed-dotted) line for radius parallel (perpendicular) to plane of (a). Thin vertical black lines indicate the locii of the various labeled optical surfaces. (c) Zoom-in on the focusing inside the crystal, pump mode radius as green dotted (red dashed) line and shaded area.
3. OSCILLATOR FABRICATION
The first step is to manufacture the substrate. This is done using a process combining femtosecond laser exposure and chemical etching, whose principle is described in [31]. In practice, a 1 mm thick, 15 cm fused silica wafer is used to carve out the whole (${{100}}\;{\rm{mm}} \times {{60}}\;{\rm{mm}}$) cavity substrate. This substrate thickness was chosen for practical reasons, but thicker substrates can also be chosen to increase natural resonant mechanical frequencies (e.g., the lowest frequency vibration mode will have a cubic dependence with substrate thickness). Here, with a 1 mm thick substrate, the three lowest frequency vibration modes of the ensemble are in the range of 400 Hz to 1 kHz.
The estimated accuracy (repeatability) of the process is about ${\pm}5\;{{\unicode{x00B5}{\rm m}}}$. The bottom-side of the substrate incorporates three v-grooves etched across the thickness, to uniquely reference the substrate and form a kinematic coupling with the eventual packaging. In the example discussed here, the optical pump optics is mounted outside of the substrate, but can also be integrated onto the same substrate. The pump beam is aligned parallel to the glass substrate and close to the center of M3.
The substrate features insertion slots in which the cavity components, mirrors, crystal, and SESAM are directly placed, here, by hand, using a pair of tweezers with curved Teflon tips. Taking advantage of the 3D capability of the micro-manufacturing process, each of the insertion slots is designed based on precision-engineering concepts, so that stability and contact points define a positioning approximate to an isostatic loading case. Built-in deformable clamps effectively lock the components in place and ensure the perpendicularity of the optical surfaces with respect to the substrate surface. Specifically, the clamps consist of two leaf-spring flexures to provide a linear translation motion (${\pm}120\;{{\unicode{x00B5}{\rm m}}}$ travel range). During insertion of the components, the clamps are retracted using a needle mounted on a precision stage.
The OC is fitted within a flexure mechanism used to fine tune the cavity by adjusting both its pitch and yaw.
Due to the intrinsic precision of the manufacturing process, after assembling the components and yet without activating the flexure mechanism, the resonator is nearly aligned as can be seen from the spontaneous emission from the excited crystal, which circulates into the cavity and exits through the OC. Yet, the alignment accuracy is not sufficient to achieve lasing and mode-locking—a fine adjustment is necessary.
To perform this operation, the far-field signal is collected on the beam profiler (WinCamD-LCM, from DataRay) (Fig. 3). The pitch and yaw are then finely adjusted according to the pattern observed.
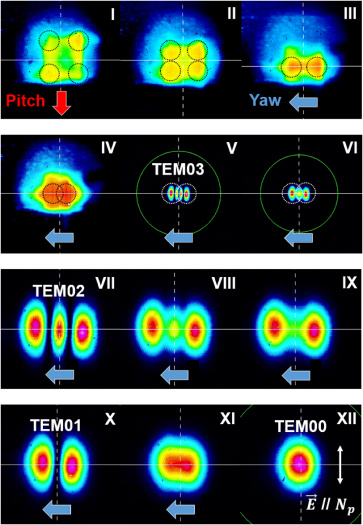
Fig. 3. Laser cavity output far-field on beam profiler during repositioning of the output coupler via actuation of the built-in micro-adjuster. Incident pump power ${P_{{\rm pump}}} \simeq 222\;{\rm{mW}}$ and ${\gt}1\;{{\unicode{x00B5}{\rm m}}}$ long-pass filter. I: light pattern as obtained after inserting the pre-aligned components. The square pattern must be folded by overlapping the four black dashed circles. II: intermediate pattern during pitch actuation. III: after completion of the pitch actuation. IV: intermediate pattern during yaw actuation. V: optical alignment sufficient to activate the TEM03 mode. VI: secondary lobes of the transverse mode are merging with yaw actuation. VII–XII: Zoomed-in images. Merging of the lobes from TEM02 to TEM00 target mode during yaw actuation. Linear polarization along ${N_p}$ crystallo-optics axis (perpendicular to glass substrate).
Inheriting from the intrinsic tolerances present in both the substrate and components, the required amplitude and direction for the alignment correction are unique to each individual manufactured laser cavity. The pattern evolution is rather quick and noticeable enough that the direction can be determined by writing only a few trial lines and reversed, if needed. During alignment, the pump power is set rather high (${P_p} \simeq 222\;{\rm{mW}}$) to compensate for the alignment losses and to obtain a clear signal on the beam profiler, but not too high, to prevent accidental triggering of intense $Q$-switched instabilities, which could damage the SESAM. Hence, the lasing threshold will be initially high, but will decrease as the alignment is perfected.
Let us walk through a representative alignment sequence. A square pattern is first observed (image I), which can be interpreted as a principal spot (lower left corner) and a secondary spot (upper right corner) spreading to the other two corners due to multi-passes inside the cavity. There, the alignment goal is to fold the light pattern into itself by bringing the top right corner onto the lower left corner, by sequentially adjusting both the pitch and yaw, slightly repositioning the OC. In the illustration, we started first with the pitch. Writing our stressor pattern below the neutral plane of the pitch actuator resulted in a counterclockwise (CCW) rotation of the OC. After laser exposure of the pitch actuator, the squarish pattern was effectively folded (sequences I to III).
Next, the yaw was adjusted. The secondary spot is consequently moved to the left (sequences III and IV), which effectively compressed the pattern (III) into the more hexagonal shape (IV). At this point of the alignment, we observed large fluctuations in intensity, which eventually led to the appearance of a very clean TEM03 mode pattern (V). Considering the geometry of the mode, we then continued adjusting the yaw until the lobes started to merge (VI). Note that doing so, we could scan through the lower-order intermediate transverse Hermite–Gaussian modes (V and VI) illustrating the accuracy and stability of the alignment process. From VII to XII, the profiles are zoomed in to better visualize the mode merging. There, one can appreciate the smooth transition from TEM02 to TEM01, and ultimately to the targeted fundamental TEM00 mode. After XII, both the pitch and yaw may be further refined to optimize the power output.
The output beam is slightly elliptic (as expected) in this example with a ratio of the waists $e \simeq 484/590 \simeq 0.82$. At this point, we stopped the adjustment procedure. To improve even further the alignment, a beam sampler can be used to redirect part of the signal onto a power meter, as was done in [20] in the context of laser-to-fiber coupling. Overall, the human-supervised adjustment time took approximately 120 min.
Based on a separate experiment, using this particular micro-adjuster design, and the test setup detailed in [19], we determined angular ranges of about ${\pm}2\;{\rm{mrad}}$ for both the pitch and yaw, which are sufficient. According to an alignment tolerance study, performed using a free software package (OptoCAD) [32], the cavity can tolerate approximately and simultaneously ${\pm}1.2\;{\rm{mrad}}$ misalignment on all components, except for the OC, which is the most sensitive element and must be aligned within ${\pm}0.5\;{\rm{mrad}}$. We also determined angular resolutions of ${\sim}21\;{\rm{nrad/mm}}$ of the laser written line (with ${\sim}218\;{\rm{nJ}}$ pulse energy) for the yaw, and ${\sim}70\;{\rm{nrad/mm}}$ (with ${\sim}198\;{\rm{nJ}}$ pulse energy) for the pitch. These resolutions are two orders of magnitude better than the most precise manually adjusted optomechanical mounts.
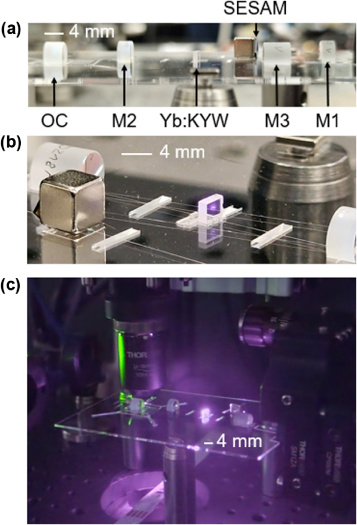
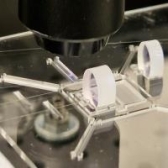
Figure 4 shows a selection of images of the fully assembled all-glass GHz laser oscillator. Figure 4(a) shows all the individual cavity components directly inserted inside the glass substrate and labeled as per the cavity design (cf. Fig. 2). One can appreciate the perpendicularity of the optical surfaces with respect to the substrate surface. In Fig. 4(b), the height of the optical axis, which links the centers of the mirrors, is further highlighted with the pump passing through the gain crystal. With the room lights switched off, teal fluorescence is visible to the naked eye, and a sensitive smartphone camera sensor can reveal the scattered near-infrared light (both the pump and amplified spontaneous emission). At this stage, the GHz cavity is misaligned and outputs the signal of image I (see Fig. 3). Figure 4(c) was taken with the lights off, right after the contactless alignment procedure and while lasing (below the mode-locking threshold). The 2-DoF yaw/pitch actuator still sits beneath the microscope objective that was used to focus the femtosecond laser beam to write the actuating stressors. The beam spot passes through the gain crystal and impinges on the center of M2. The GHz cavity outputs the TEM00 mode of image XII (see Fig. 3).
Fig. 4. Assembled all-glass GHz oscillator. (a) Side view with all cavity components labeled. (b) Close-up view of the laser crystal (before final alignment), with fluorescence and pump beam passing through, above the glass substrate surface. NIR emission is revealed by a smartphone image sensor. (c) Right after the permanent alignment correction by femtosecond laser exposure of both the pitch and yaw of the output coupler. 4 mm scale bars.
4. LASER CAVITY OPTICAL CHARACTERIZATION
The average power was measured using a thermopile sensor (3A head and StarLite power meter from MKS Ophir). Figure 5(a) shows the relation between the pump laser diode injection current ${I_{{\rm LD}}}$ versus optical pump power ${P_{{\rm pump}}}$. Here, pump power refers to the power incident onto the back of mirror M3. The transmission through M3 and hence the fraction effectively absorbed in the crystal are therefore not accounted for, which overestimate the effective optical pump power, and thus underestimate the real efficiency by a few percent. Using a linear fit, we retrieved the following relation power/pump current relation: ${P_{{\rm pump}}} = 0.61*{I_{{\rm LD}}} - 42\,(\rm mW)$.
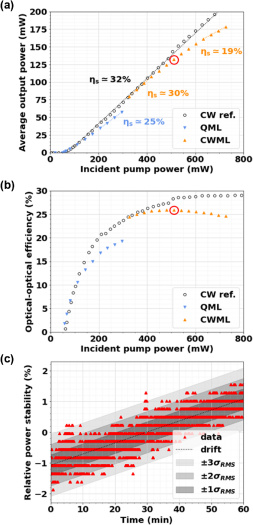
Fig. 5. Average output power characteristics. (a) Plotted as a function of average incident optical pump power. Black circles: reference data points from a CW oscillator with HR mirror instead of SESAM. Blue downward pointing triangles: $Q$-switched mode-locking operation. Orange upward pointing triangles: continuous-wave mode-locked operation. Slope efficiencies from local linear fits. (b) Optical to optical conversion efficiency. (c) Relative power stability with respect to the overall mean value captured over 1 h, during mode-locking, taken at the data point circled in red in (a), (b). Black dotted line reveals a linear drift tendency. Gray shadowed areas indicate one, two, and three sigma root mean square intervals.
A first laser cavity operated in CW mode (shown with black circles) with the same geometrical configuration as the final GHz fs oscillator and same components, but with a highly reflective (HR) mirror terminating the cavity in place of the SESAM, was built as a reference to define the best achievable efficiency of this resonator design and pump configuration. The CW cavity exhibits a 60 mW lasing threshold and ${\eta _s} \simeq 32\%$ slope efficiency. The second set of data refers to a second oscillator, according to the same configuration as the first oscillator, except that this time the HR mirror terminating the cavity is replaced with the SESAM. The threshold now occurs around 50 mW, from which the output power ramps up with an approximately ${\eta _s} \simeq 25\%$ slope efficiency. Above 296 mW incident pump power, the system transitions to a self-starting mode-locking regime, with a characteristic discontinuity and increase in slope efficiency, which is a signature of the change in intracavity losses by saturation of the SESAM and the formation of the soliton. Before this power discontinuity, the output power reaches 57 mW, corresponding to 5.7 W intracavity power, or approximately 5.2 nJ intracavity pulse energy at 1.09 GHz repetition rate. Assuming a $1529\;{{\unicode{x00B5}}}{{\rm{m}}^2}$ mode area onto the SESAM, we retrieve a pulse fluence of $F \simeq 6.8\,{F_{{\rm sat}}} \simeq 341\;{{{\unicode{x00B5}}\rm J}}/{\rm{cm}}^2$. With further increase of the pump power, the output power continues to ramp up with a maximum slope efficiency reaching ${\eta _s} \simeq 30\%$, which eventually decreases to 19% (as indicated with the red circle on the yellow curve). This effect can have multiple interpretations. A first possible one is over-saturation of the gain crystal, with the pump delivering up to ${\simeq} 150\;{\rm{kW}}/{\rm{cm}}^2$ in the medium, i.e., ${\sim}71$ times the ${\sim}2.1\;{\rm{kW}}/{\rm{cm}}^2$ saturation intensity of Yb:KYW [33]; however the value is similar to the factor of 60 reached in [34], for which the effect was not observed. A second one is overheating and lensing from the crystal, which is not sufficiently cooled.
A counter-argument is that no loss of efficiency or mode distortion is observed in the CW oscillator; the thermal load is rather limited, and the quantum defect of Yb:KYW is an advantage here, with an estimation of less than ${\sim}50\;{\rm{mW}}$ absorbed by the crystal. Hence the effect may be more related to thermal effects in the SESAM [35] or to the instant peak power rather than the average power. The “rollover” of the SESAM non-linear reflectivity, linked to the inverse absorption coefficient ${F_2}$ [36], is a known effect. This hypothesis is supported by the last recorded data point, for which the pulse fluence incident on the SESAM is estimated to be $F \simeq 21\,{F_{{\rm sat}}} \simeq 1\;{\rm{mJ}}/{\rm{cm}}^2$.
Furthermore, using a thermal camera (Ti32, from Fluke), we confirmed that both the crystal and SESAM remained below 50° even at the highest operation point. However, the spatial resolution of this camera prevented direct observation of possible thermal lens gradients.
The slope efficiency of the mode-locked (ML) oscillator does not fully reach the efficiency of the CW reference curve since at full saturation, the SESAM used in this experiment reaches at most 99.4% reflectivity, which is lower than the 99.998% of the HR reflector used in CW operation.
Figure 5(b) illustrates the same data as in 5(a), but translated into optical-to-optical conversion efficiency ${\eta _{{\rm opt}}} = {P_{{\rm out}}}/{P_{{\rm pump}}}$. There, the reference CW data eventually reach a plateau around ${\eta _{{\rm opt}}} \simeq 32\%$. For the ML oscillator, the conversion efficiency is capped at ${\eta _{{\rm opt}}} \simeq 25\%$ in the quasi-CW operation mode, and then suddenly jumps to about 5%, when the mode-locking threshold is crossed. Then it eventually peaks at ${\eta _{{\rm opt}}} \simeq 26\%$, before degrading. These measured efficiencies are comparable to the one reported in [37], in which a ${\eta _s} \simeq 36\%$ slope efficiency in a CW configuration and ${\eta _{{\rm opt}}} \simeq 24\%$ in ML are documented for a Kerr-lens ML oscillator configuration (1.2 mm thick Yb:KYW crystal, 10% concentration, $E//{N_m}$ polarization). In this particular work, the pump mode field was magnified two times to ${w_p} \simeq 8\;{\rm{\unicode{x00B5}{\rm m}}}$ radius, and a 0.5% OC was used. In another work [34], record efficiencies of ${\eta _s} \simeq 69\%$ and ${\eta _{{\rm opt}}} \simeq 61\%$ were reported (0.72 mm thick Yb:KYW crystal, 10% concentration, $E//{N_m}$ polarization), but this time with a SESAM ML oscillator configuration. In their case, an OC with 5% transmission and ${w_p} \simeq 17\;{{\unicode{x00B5}{\rm m}}}$ spot radius was used. The authors attributed the high values to multiple factors, including the overlap between cavity and pump modes, pumping at 981 nm, a dual-pumping scheme, and a thin crystal that further lowers re-absorption.
In our case, the cavity-to-pump mode size ratio is ${w_p}/{w_c} \simeq 0.6$. As explained in [38], a value lower than unity favors a low lasing threshold, as observed here. In other works [39,40], the optimal ratio that favors a higher slope efficiency, and thus output power, is supposedly closer to unity. According to [41], except for pumping near the lasing threshold, the optimum is always found for ${w_p}/{w_c} \lt 1$, which also helps prevent transverse modes oscillations.
The output power was recorded over 1 h while the laser was mode-locking. The relative power stability over time, $({P_{{\rm out}}}(t) - {P_{{\rm mean}}})/{P_{{\rm mean}}}*100$, is reported in Fig. 5(c). A general slow linear trend can be noticed, with on top, fast smaller fluctuations. A linear fit ${0.0358}\;{{*}}\;{\rm{t}}\;{ - }\;{1.0740}$ (%) captures this drift, which is responsible for a steady 2% global increase over 1 h. This drift is likely of thermal origin. Indeed, in [42], the authors also have a GHz oscillator open to the air, and they observe a strong positive correlation between the output power and the ambient temperature variations in the room. If we focus on the first 2–3 h, there is a linear increase of about 2% of the output power, in parallel to an ambient temperature increase of 0.5°. Temperature variations can (reversibly) impact the oscillator alignment, but also the temperature gradient (i.e., thermal lens) inside the crystal, which alters the pump–cavity mode overlap, and thus the lasing efficiency.
By subtracting this drift component and summing all the time slices, we can build a histogram with clear Gaussian distribution. From its fit, we retrieve ${\sigma _{{\rm RMS}}} \simeq 0.34\%$ fluctuations. Our value is nearly half the one reported in [43]. The authors obtained an output power stability of 0.63% (RMS), measured over 1000 s, with their 1.2 GHz oscillator, which was built with conventional optomechanics and used a 2 mm thick Brewster-cut Yb:KYW crystal with 5% concentration.
Note that our cavity was not hermetically sealed and not placed in a clean-room environment, and thus, open to ambient air flow and dust particles. Despite these sub-optimal working conditions, the oscillator remained ML. The trace does not feature repeated large spikes that would indicate problematic $Q$-switching instabilities, and the absence of a significant power drop indicates that the SESAM did not get damaged.
The stability performance could be significantly improved by proper thermal management of the packaged oscillator, active feedback on the pump laser diode, and possibly by turning the crystal to the Brewster angle to filter out the polarization of the laser emission.
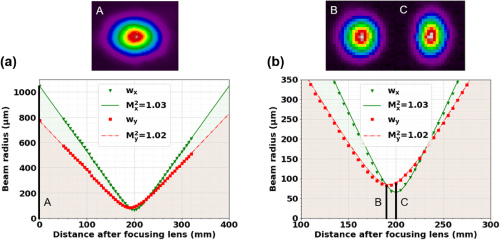
The beam quality [Fig. 6(a)], and hence the waist profile, was measured using a beam profiler (WinCamD-LCM from DataRay) mounted on a translation rail for the beam being focused with a 150 mm lens. This focal parameter was chosen to be long enough to ensure a sufficiently high number of representative data points in the vicinity of the focusing point and a minimum spot size above the 60 µm diameter resolution of the spot imaging sensor. Closer inspection of the focus, zoomed-in in Fig. 6(b), reveals clear evidence of astigmatism, as expected from the resonator design, which can be reduced by further reducing the three folding mirrors (M1, M2, and M3) and the crystal rotation angles. The data fit reasonably well with ${M^2}$ values of $M_x^2 = 1.03 \pm 0.03$ and $M_y^2 = 1.02 \pm 0.02$, indicating that the laser beam is essentially diffraction limited and suited for coupling inside a single-mode fiber. The $y$ component reaches a minimum diameter at ${{d}} = {{193}}\;{\rm{mm}}$, where the beam is nearly perfectly round (see inset B, $e \simeq 0.96$), while the $x$ component reaches minimum at ${{d}} = {{200}}\;{\rm{mm}}$ where a slight elliptical profile is recovered (inset ${{C}}$, $e \simeq 0.72$). Such elliptical profile can be corrected, for instance, using a cylindrical lens.
Fig. 6. Output beam characteristics. ${\rm{M}}$-squared measurement with a ${{f}} = {{150}}\;{\rm{mm}}$ focusing lens. (a) Half-waist as a function of distance, away from the lens. Green triangles represent the waist projected along a direction parallel to the cavity substrate, while red squares show the project along a perpendicular direction. Inset A: beam profile taken at the entrance of the focusing lens, a point indicated by a solid black line in the waist curve profile. (b) Zoom-in of the waist curve nearby the focusing region. Corresponding beam profiles are shown in insets ${\rm{B}}$ and ${\rm{C}}$, taken at the two focii points. The best fits are displayed as dashed lines on the waist profiles.
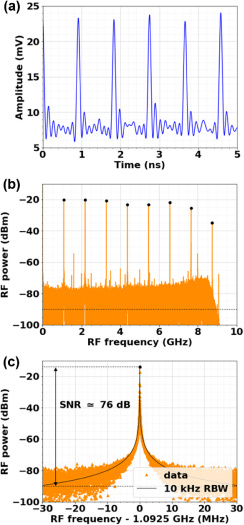
Fig. 7. Pulse train characteristics. (a) 5 ns time scale pulse train waveform. (b) Fourier-transformed spectrum illustrating regularly spaced fundamental and harmonic comb lines. (c) Isolated fundamental comb line centered at 1.0925 GHz repetition rate. The black dotted line indicates the oscilloscope resolution limit. A 50 Ohms impedance is used. Incident pump power set to ${P_{{\rm pump}}} \simeq 511\;{\rm{mW}}$.
To analyze the pulse train in the ML regime, the output free-space beam was sent through a neutral density wheel for variable attenuation, and shone onto an ultrafast photodiode (Alphalas, UPD-35-IR2-P) with 10 GHz bandwidth (i.e., 35 ps rise time), itself connected to an 8.4 GHz bandwidth oscilloscope (Keysight, MSO-S 804A), providing up to 20 GSa/s sampling rate. The 50 Ohms channel impedance converts the photocurrent generated by the photodiode into a voltage signal. The results are shown in Fig. 7. Figure 7(a) displays the trace taken over a 5 ns time window, revealing the individual pulses. The processed pulse-to-pulse temporal differences (or so-called “timing jitter”) indicates an average period ${{T}} \simeq 915\;{\rm{ps}}$. The amplitude variation is likely an aliasing artifact resulting from the picosecond range temporal resolution of the oscilloscope, much larger than the sub-ps real duration of the pulses, which prevents accurate reconstruction of the signal envelope waveform, in particular the positions of the peaks. Figure 7(b) is the Fourier transform of the pulse train, taken with a resolution bandwidth (RBW) of 100 kHz. It reveals the radio-frequency comb, with the fundamental peak found at the repetition rate frequency 1.0925 GHz and the harmonics comb teeth regularly spaced by the same value. The noise floor averages at approximately ${-}{{90}}\;{\rm{dBm}}$. Intermittent features are also found in between the frequency comb-lines, peaking in between approximately ${-}{{70}}\;{\rm{dBm}}$ and ${-}{{55}}\;{\rm{dBm}}$. We interpret it as the signature of parasitic reflections still amplified by the oscillator or the excitation of transverse higher-order modes. This effect may be suppressed by further optimizing the cavity–pump overlap. By design, we expected a repetition rate of 1.0938 GHz. However, with a precision gauge measurement, the real crystal thickness was found to be 58 µm thicker than assumed, which then lowers the predicted repetition rate to 1.0934 GHz, an offset of only 860 kHz from the actual measurement (i.e., a relative discrepancy of $\Delta {f_{{\rm rep}}}/{f_{{\rm rep}}} \simeq 0.08\%$). Translated into a position accuracy, it means that the fabricated cavity is approximately ${\sim}100\,{{\unicode{x00B5}{\rm m}}}$ longer than the initial concept, which, considering all the stacked tolerances along the 137 mm optical length of the cavity, illustrates how accurate our manufacturing method is. Finally, Fig. 7(c) zooms in on the fundamental frequency. A Lorentzian function with a FWHM corresponding to the instrument RBW limit of 10 kHz is superimposed.
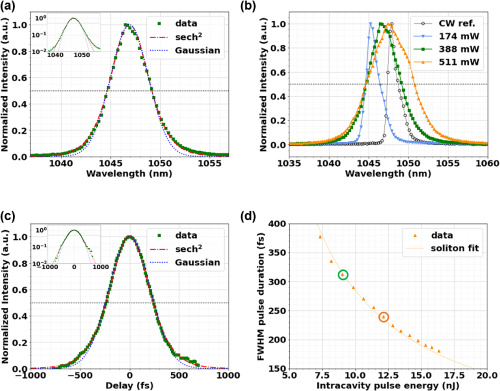
Fig. 8. Analysis of the quasi-soliton pulse produced by the cavity. (a) Spectral line in continuous-wave mode-locked (CWML) operation, fitted with a hyperbolic secant-squared profile (red dotted-dashed) and Gaussian profile (green dotted). Semi-log inset. (b) Spectral lines at different incident pump powers. Blue downward triangles: $Q$-switched mode-locked (QML) operation below threshold, for 174 mW. Green squares: CWML operation, corresponding to data from (a), for 388 mW. Orange upward triangles: CWML operation for 511 mW. Black circles: CW reference from oscillator with HR mirror. (c) Intensity auto-correlation trace of the soliton pulse, corresponding to the case of Fig. 7(a), fitted with hyperbolic secant-squared profile (red dotted-dashed) and a Gaussian profile (green dotted). Semi-log inset. (d) Pulse duration as a function of intra-cavity pulse energy. The green circle highlights the data point associated with (a), (c). The orange circle corresponds to the orange spectrum in (b). The quasi-soliton pulse-compression model is plotted as a dotted line.
Back of the envelope estimations predict that the ${\sim}137\;{\rm{mm}}$ long fused silica cavity would at least experience cavity length fluctuations within ${\pm}69\;{\rm{nm}}$ for ${\pm}1^{\circ}$ Celsius fluctuations around room temperature. This corresponds to a variation of the repetition rate of ${\sim}550\;{\rm{Hz}}$, which we cannot resolve with our current equipment. This estimated value is half what the authors of [14] recorded with an aluminum substrate. Fluctuation levels below 10 kHz and our all-glass approach are perfectly compatible with schemes for active stabilization. This can be done by the monolithic integration of a linear electrostatic translation micro-actuator [44–46] to quickly and continuously adjust the length of the cavity. Nevertheless, the linewidth and the ${\sim}76\;{\rm{dB}}$ SNR, comparable to [42], indicate that our “all-glass” laser cavity performs well, even if not hermetically sealed or actively stabilized.
A spectrometer with a ${\sim}0.8\;{\rm{nm}}$ resolution (HR4000CG-UV-NIR, from Ocean Insight) was used to estimate the spectral linewidth. The spectrum at 388 mW incident pump power (shown in Fig. 8) displays a single emission line centered at ${\lambda _0} \simeq 1046.5\;{\rm{nm}}$. A hyperbolic secant-squared profile fits better the data than a Gaussian, which is the signature of a clean quasi-soliton. Accounting for instrument broadening, we estimate a FWHM of $\Delta \lambda \simeq 3.7\;{\rm{nm}}$ (${+}{0.8}\;{\rm{nm}}$), i.e., a real FWHM of 3.7 nm ($\Delta \nu \simeq 1.013\;{\rm{THz}}$). Figure 8(b) shows the emission line evolution with an increasing incident pump power. At ${P_{{\rm pump}}} \simeq 174\;{\rm{mW}}$ (i.e., below the mode-locking threshold), the line peaks at ${\lambda _0} \simeq 1045.2\;{\rm{nm}}$ with $\Delta \lambda \simeq 1.0\;{\rm{nm}}$ (${+}{0.8}\;{\rm{nm}}$). Well above the mode-locking threshold, for ${P_{{\rm pump}}} \simeq 511\;{\rm{mW}}$, it peaks at ${\lambda _0} \simeq 1047.4\;{\rm{nm}}$ with $\Delta \lambda \simeq 5.4\;{\rm{nm}}$ (${+}{0.8}\;{\rm{nm}}$). Upon a gradual increase of pump power, the spectral line progressively redshifts towards the reference line of the CW oscillator, ${\lambda _0} \simeq 1047.9\;{\rm{nm}}$ and $\Delta \lambda \simeq 0.6\;{\rm{nm}}$ (${+}{0.8}\;{\rm{nm}}$), due to the reduction of cavity losses, while self-phase modulation broadens the pulse bandwidth.
To estimate the temporal pulse width, we used an autocorrelator (Mini, from APE) switched to a background-free non-collinear mode. The autocorrelation trace for ${P_{{\rm pump}}} \simeq 388\;{\rm{mW}}$ is reported in Fig. 8(c) and compared with both a hyperbolic secant-squared and a Gaussian profile to confirm once more the signature of a quasi-soliton pulse with minimal chirp. Such conditions are found when the negative dispersion introduced by the GTI mirror (M1) is well balanced with the self-phase modulation of the crystal. From this curve fitting, we recovered a FWHM intensity autocorrelation of ${\tau _A} = 480 \pm 2\;{\rm{fs}}$, which, taking into account the convolution factor for hyperbolic secant-squared, translates into an estimated pulse duration of $\Delta \tau = 0.6482{\tau _A} = 311 \pm 1\;{\rm{fs}}$. With this information, we estimate the time–bandwidth product as $\Delta \tau .\Delta \nu \simeq 0.315 \pm 0.001 \ge 0.3148$, which indicates that the quasi-soliton pulse is indeed Fourier-transform limited.
Finally, Fig. 8(d) reports the pulse duration (assuming a hyperbolic secant-squared fit) as a function of the intracavity pulse energy, above the mode-locking threshold. There, the pulse duration decreases from $\Delta \tau = 377 \pm 3\;{\rm{fs}}$ for ${E_p} \sim 7.3\;{\rm{nJ}}$ (${P_{{\rm pump}}} \simeq\def\LDeqbreak{} 327\;{\rm{mW}}$), to $\Delta \tau = 181 \pm 2\;{\rm{fs}}$ for ${E_p} \sim 16.3\;{\rm{nJ}}$ (${P_{{\rm pump}}} \simeq 725\;{\rm{mW}}$), which corresponds to an increase from an estimated ${P_{{\rm peak}}} \simeq 171 \pm 1\;{\rm{W}}$ peak power to ${P_{{\rm peak}}} \simeq 793 \pm 8\;{\rm{W}}$ peak power. Using the nonlinear refractive index ${n_2} \simeq {8.6*10^{- 20}}\;{{\rm{m}}^2}/{\rm{W}}$ for $E//{N_p}$ [47], we compute a self-phase modulation coefficient of ${\gamma _{{\rm SPM}}} \simeq 658\;{\rm{nrad/W}}$. At the ML mode-locking threshold, we estimate a nonlinear phase change of ${\phi _{{\rm NL}}} \simeq 11\;{\rm{mrad}}$ per single pass. The characteristic non-linear ${L_{{\rm NL}}}$ and dispersion ${L_D}$ lengths are approximately equal, hence why the formula $\Delta \tau = 1.7627*2*{{\rm GDD}_{{\rm tot}}}/(|{\gamma _{{\rm SPM}}}|{E_p})$ for a quasi-soliton model can be used to fit the data. The FWHM pulse duration trend is well reproduced. From the fit, we retrieved a net total intracavity GDD ${{\rm GDD}_{{\rm tot}}} = - 569(\pm 4)\;{\rm{f}}{{\rm{s}}^2}$ per single pass, out of which we extract a combined contribution of $269(\mp 104)\,\rm fs^{2}$ from the crystal, SESAM, and air medium. According to this model and assuming ${\eta _{{\rm opt}}} \simeq 25\%$ [cf. Fig. 5(b)], we can extrapolate and reasonably expect further pulse compression down to $\Delta \tau \simeq 150\;{\rm{fs}}$, with up to ${P_{{\rm out}}} \simeq 208\;{\rm{mW}}$ average output power, ${P_{{\rm peak}}} \simeq 1.1\;{\rm{kW}}$ peak power, for ${E_p} \sim 19\;{\rm{nJ}}$ intracavity pulse energy and ${P_{{\rm pump}}} \simeq 832\;{\rm{mW}}$ incident pump power. This performance can be compared to the 50 mm long oscillator (i.e., 2.864 GHz) from [48], which uses 2.6 W of pump power to generate 162 fs pulses having 1.5 kW peak power.
5. CONCLUSION
We demonstrated a novel concept of a palm-sized all-glass femtosecond laser GHz oscillator cavity that leverages femtosecond laser processing methods. A femtosecond laser is used to process a glass substrate with predefined features for component assembly, as well as built-in embedded flexural elements that can be permanently fine tuned remotely using the same laser to achieve an ultra-accurate positioning, with sub-nanometer and sub-radian angular resolutions.
Specifically, we demonstrated a low-power GHz repetition ML femtosecond laser oscillator, delivering sub-200 fs Fourier-limited sech-squared pulses, with up to ${\sim}163\;{\rm{pJ}}$ pulse energy and ${\sim}793\;{\rm{W}}$ peak power, packaged on a credit card footprint and passively cooled.
In essence, a femtosecond laser is used to manufacture another femtosecond laser, offering a paradigm shift not only in the design of laser cavities, but also in their manufacturing. The manufacturing concept is suitable for higher repetition rates, from 10 GHz ([49]) up to 100 GHz ([50]). It is generic and can be expanded to other types of miniature cavities. Finally, this concept offers a new paradigm in optical system manufacturing, applicable to a variety of free-space miniature optical systems (e.g., interferometers, beam shapers).
Funding
HORIZON EUROPE European Research Council (ERC-2017-PoC-790169); École Polytechnique Fédérale de Lausanne (S039-IG-21-04); Schweizerischer Nationalfonds zur Förderung der Wissenschaftlichen Forschung (40B1-0_211781).
Acknowledgment
The Galatea Lab acknowledges the sponsoring of Richemont International. The authors thank Steve Lecomte for his valuable comments.
Author contributions AD designed, fabricated, characterized, and tested the prototypes presented here. SN contributed to the flexural element design, and the related preliminary implementation. SH investigated a first CW prototype with an external mirror. CH participated in discussion and provided advice for the cavity design. AD and YB wrote the initial paper. YB proposed the initial concept, designed, and supervised the research. All authors commented on the paper and its revisions.
Disclosures
The authors declare no conflicts of interest.
Data availability
Data underlying the results presented in this paper are not publicly available at this time but may be obtained from the authors upon reasonable request.
REFERENCES
1. R. R. Gattass and E. Mazur, “Femtosecond laser micromachining in transparent materials,” Nat. Photonics 2, 219–225 (2008). [CrossRef]
2. K. Sugioka and Y. Cheng, “Ultrafast lasers—reliable tools for advanced materials processing,” Light Sci. Appl. 3, e149 (2014). [CrossRef]
3. S. H. Chung and E. Mazur, “Surgical applications of femtosecond lasers,” J. Biophoton. 2, 557–572 (2009). [CrossRef]
4. T. Kato, M. Uchida, Y. Tanaka, and K. Minoshima, “High-resolution 3D imaging method using chirped optical frequency combs based on convolution analysis of the spectral interference fringe,” OSA Contin. 3, 20–30 (2020). [CrossRef]
5. I. Coddington, N. Newbury, and W. Swann, “Dual-comb spectroscopy,” Optica 3, 414–426 (2016). [CrossRef]
6. T. Fortier and E. Baumann, “20 years of developments in optical frequency comb technology and applications,” Commun. Phys. 2, 1–16 (2019). [CrossRef]
7. H. Haus, “Mode-locking of lasers,” IEEE J. Sel. Top. Quantum Electron. 6, 1173–1185 (2000). [CrossRef]
8. U. Keller, “Recent developments in compact ultrafast lasers,” Nature 424, 831–838 (2003). [CrossRef]
9. U. Keller, “Ultrafast solid-state laser oscillators: a success story for the last 20 years with no end in sight,” Appl. Phys. B 100, 15–28 (2010). [CrossRef]
10. T. Südmeyer, S. V. Marchese, S. Hashimoto, C. R. E. Baer, G. Gingras, B. Witzel, and U. Keller, “Femtosecond laser oscillators for high-field science,” Nat. Photonics 2, 599–604 (2008). [CrossRef]
11. G. Chang and Z. Wei, “Ultrafast fiber lasers: an expanding versatile toolbox,” iScience 23, 101101 (2020). [CrossRef]
12. K. Saha, Y. Okawachi, B. Shim, J. S. Levy, R. Salem, A. R. Johnson, M. A. Foster, M. R. E. Lamont, M. Lipson, and A. L. Gaeta, “Modelocking and femtosecond pulse generation in chip-based frequency combs,” Opt. Express 21, 1335–1343 (2013). [CrossRef]
13. T. D. Shoji, W. Xie, K. L. Silverman, A. Feldman, T. Harvey, R. P. Mirin, and T. R. Schibli, “Ultra-low-noise monolithic mode-locked solid-state laser,” Optica 3, 995–998 (2016). [CrossRef]
14. Y. Feng, T. P. Lamour, H. Ostapenko, R. A. McCracken, O. Mandel, D. Weise, and D. T. Reid, “Towards a space-qualified Kerr-lens mode-locked laser,” Opt. Lett. 46, 5429–5432 (2021). [CrossRef]
15. Y. Bellouard, A. A. Said, and P. Bado, “Integrating optics and micro-mechanics in a single substrate: a step toward monolithic integration in fused silica,” Opt. Express 13, 6635–6644 (2005). [CrossRef]
16. Y. Bellouard, “On the bending strength of fused silica flexures fabricated by ultrafast lasers [Invited],” Opt. Mater. Express 1, 816–831 (2011). [CrossRef]
17. V. Tielen and Y. Bellouard, “Three-dimensional glass monolithic micro-flexure fabricated by femtosecond laser exposure and chemical etching,” Micromachines 5, 697–710 (2014). [CrossRef]
18. Y. Bellouard, “Non-contact sub-nanometer optical repositioning using femtosecond lasers,” Opt. Express 23, 29258–29267 (2015). [CrossRef]
19. S. I. Nazir and Y. Bellouard, “A monolithic gimbal micro-mirror fabricated and remotely tuned with a femtosecond laser,” Micromachines 10, 611 (2019). [CrossRef]
20. S. I. Nazir and Y. Bellouard, “Contactless optical packaging concept for laser to fiber coupling,” IEEE Trans. Compon. Packag. Manuf. Technol. 11, 1035–1043 (2021). [CrossRef]
21. A. Champion and Y. Bellouard, “Direct volume variation measurements in fused silica specimens exposed to femtosecond laser,” Opt. Mater. Express 2, 789–798 (2012). [CrossRef]
22. P. Hartmann, R. Jedamzik, S. Reichel, and B. Schreder, “Optical glass and glass ceramic historical aspects and recent developments: a Schott view,” Appl. Opt. 49, D157–D176 (2010). [CrossRef]
23. L. A. Moore and C. M. Smith, “Fused silica as an optical material [Invited],” Opt. Mater. Express 12, 3043–3059 (2022). [CrossRef]
24. T. Döhring, R. Jedamzik, T. Westerhoff, and P. Hartmann, “Four decades of ZERODUR mirror substrates for astronomy,” Proc. SPIE 7281, 19–30 (2009). [CrossRef]
25. L. Pinard, C. Michel, B. Sassolas, L. Balzarini, J. Degallaix, V. Dolique, R. Flaminio, D. Forest, M. Granata, B. Lagrange, N. Straniero, J. Teillon, and G. Cagnoli, “Mirrors used in the LIGO interferometers for first detection of gravitational waves,” Appl. Opt. 56, C11–C15 (2017). [CrossRef]
26. K. Cvecek, S. Dehmel, I. Miyamoto, and M. Schmidt, “A review on glass welding by ultra-short laser pulses,” Int. J. Extrem. Manuf. 1, 042001 (2019). [CrossRef]
27. S. I. Nazir, C. E. Athanasiou, and Y. Bellouard, “On the behavior of uniaxial static stress loaded micro-scale fused silica beams at room temperature,” J. Non-Cryst. Solids X 14, 100083 (2022). [CrossRef]
28. P. Vlugter, E. Block, and Y. Bellouard, “Local tuning of fused silica thermal expansion coefficient using femtosecond laser,” Phys. Rev. Mater. 3, 053802 (2019). [CrossRef]
29. G. Bonamis, “Conception et réalisation d’une source laser femtoseconde GHz et applications au régime d’ablation très haute cadence,” Ph.D. thesis (Université de Bordeaux, 2020).
30. https://www.rezonator.orion-project.org.
31. Y. Bellouard, A. Said, M. Dugan, and P. Bado, “Fabrication of high-aspect ratio, micro-fluidic channels and tunnels using femtosecond laser pulses and chemical etching,” Opt. Express 12, 2120–2129 (2004). [CrossRef]
32. Credits to Roland Schilling.
33. A. A. Lagatsky, N. V. Kuleshov, and V. P. Mikhailov, “Diode-pumped CW lasing of Yb:KYW and Yb:KGW,” Opt. Commun. 165, 71–75 (1999). [CrossRef]
34. T. C. Schratwieser, C. G. Leburn, and D. T. Reid, “Highly efficient 1 GHz repetition-frequency femtosecond Yb3+:KY(WO4)2 laser,” Opt. Lett. 37, 1133–1135 (2012). [CrossRef]
35. S. L. Schieffer, J. A. Berger, B. L. Rickman, V. P. Nayyar, and W. A. Schroeder, “Thermal effects in semiconductor saturable-absorber mirrors,” J. Opt. Soc. Am. B 29, 543–552 (2012). [CrossRef]
36. C. J. Saraceno, C. Schriber, M. Mangold, M. Hoffmann, O. H. Heckl, C. R. E. Baer, M. Golling, T. Südmeyer, and U. Keller, “SESAMs for high-power oscillators: design guidelines and damage thresholds,” IEEE J. Sel. Top. Quantum Electron. 18, 29–41 (2012). [CrossRef]
37. P. Wasylczyk, P. Wnuk, and C. Radzewicz, “Passively modelocked, diode-pumped Yb:KYW femtosecond oscillator with 1 GHz repetition rate,” Opt. Express 17, 5630–5636 (2009). [CrossRef]
38. D. G. Hall, R. J. Smith, and R. R. Rice, “Pump-size effects in Nd:YAG lasers,” Appl. Opt. 19, 3041–3043 (1980). [CrossRef]
39. D. G. Hall, “Optimum mode size criterion for low-gain lasers,” Appl. Opt. 20, 1579–1583 (1981). [CrossRef]
40. F. Salin and J. Squier, “Geometrical optimization of longitudinally pumped solid-state lasers,” Opt. Commun. 86, 397–400 (1991). [CrossRef]
41. P. Laporta and M. Brussard, “Design criteria for mode size optimization in diode-pumped solid-state lasers,” IEEE J. Quantum Electron. 27, 2319–2326 (1991). [CrossRef]
42. R. Wüst, D. Hug, B. Rudin, F. Emaury, and B. Resan, “250 fs, 130 mW laser with tunable pulse repetition rate from 0.5 to 1.3 GHz,” IEEE Photon. J. 14, 3351506 (2022). [CrossRef]
43. H.-W. Yang, C. Kim, S. Y. Choi, G.-H. Kim, Y. Kobayashi, F. Rotermund, and J. Kim, “1.2-GHz repetition rate, diode-pumped femtosecond Yb:KYW laser mode-locked by a carbon nanotube saturable absorber mirror,” Opt. Express 20, 29518–29523 (2012). [CrossRef]
44. B. Lenssen and Y. Bellouard, “Optically transparent glass micro-actuator fabricated by femtosecond laser exposure and chemical etching,” Appl. Phys. Lett. 101, 103503 (2012). [CrossRef]
45. G. G. Melpignano, A. Schaap, and Y. Bellouard, “Design and fabrication of a prototype actuator for Fourier transform interferometry,” in Progress in Optomechatronic Technologies, R. Tutsch, Y.-J. Cho, W.-C. Wang, and H. Cho, eds., Lecture Notes in Electrical Engineering (Springer, 2014), pp. 97–105.
46. T. Yang and Y. Bellouard, “Monolithic transparent 3D dielectrophoretic micro-actuator fabricated by femtosecond laser,” J. Micromech. Microeng. 25, 105009 (2015). [CrossRef]
47. K. V. Yumashev, A. G. Selivanov, I. A. Denisov, and N. V. Kuleshov, “Polarized Z-scan measurements of nonlinear refractive index for Yb3+-doped KY(W04)2 and YV04 laser crystals,” in Advanced Solid-State Photonics (Optica, 2006), paper WB1.
48. S. Yamazoe, M. Katou, T. Adachi, and T. Kasamatsu, “Palm-top-size, 1.5 kW peak-power, and femtosecond (160 fs) diode-pumped mode-locked YB+3:KY(WO4)2 solid-state laser with a semiconductor saturable absorber mirror,” Opt. Lett. 35, 748–750 (2010). [CrossRef]
49. L. M. Krüger, A. S. Mayer, Y. Okawachi, X. Ji, A. Klenner, A. R. Johnson, C. Langrock, M. M. Fejer, M. Lipson, A. L. Gaeta, V. J. Wittwer, T. Südmeyer, C. R. Phillips, and U. Keller, “Performance scaling of a 10-GHz solid-state laser enabling self-referenced CEO frequency detection without amplification,” Opt. Express 28, 12755–12770 (2020). [CrossRef]
50. A. E. H. Oehler, T. Südmeyer, K. J. Weingarten, and U. Keller, “100 GHz passively mode-locked Er:Yb:glass laser at 1.5 µm with 1.6-ps pulses,” Opt. Express 16, 21930–21935 (2008). [CrossRef]